
Ethereum has not been at its best over the last seven days, and it has made an overall loss of 1.63%. The price trend of ETH coin can be divided into three major price swings in the range of 191.5 USD and 178.4 USD.
Ethereum Price Analysis
ETH opened the week at 183.36 USD, and the first variation happened by November 10, and this variation added 4.44% value to the Ethereum price and pushed it to 191.50 USD. At 16:15 UTC, it started weakening and lost 4.64% to touch 182.64 USD by 15:20 UTC on November 12. The last variation happened between November 13 & 15, and in these 2 days, Ethereum lost 5.34% of the value and got placed at 178.40 USD, the lowest point of the week.
The market cap of Ethereum has also been down in these seven days. On November 9, the market cap was at 20.074 billion USD, and now it has fallen to 19.672 billion USD.
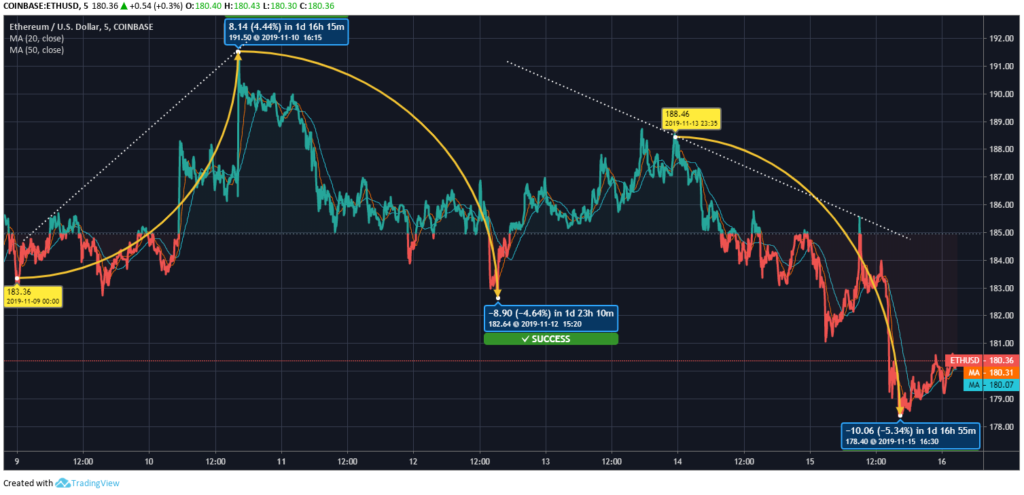
Ethereum’s 20 days MA is 180.31 USD, and its 50-days MA is at 180.07 USD. Ethereum’s next support may come at 177 USD.
Resistance and Support Levels
R1- $184.72, R2- $188.92, R3- $ 191.59
S1- $177.85, S2- $175.18, S3- $170.98